Current Research
Fish invaders invoke a lifetime of trophic change in native desert fishes
Manuscript in press (Ecosphere)
Co-author: Julian Olden
Trophic interactions operate across the lifetime of an individual organism, yet our understanding of these processes are largely limited to a single life-stage or moment in time. Management and conservation implications of this knowledge gap are particularly important given the mounting number, spread, and ecological impacts of invasive species. Biotracers such as carbon and nitrogen stable isotopes of animal muscle, for example, are commonly used to characterize the trophic ecology of an individual, but fail to capture intra-individual variation and ontogenetic dietary shifts. However, recent work suggests that eye lenses may facilitate the reconstruction of individual lifetime trophic trajectories for fishes, including the chronology of past trophic positions of and carbon flow to consumers. By combining stable isotope analysis of fish eye lens tissue with aging techniques (otolith growth measurements), this study is the first to ask how the lifetime trophic niche of individuals vary within different community contexts. The results provide evidence for asymmetric competition causing differing trajectories in lifetime trophic niches for native and nonnative fishes along an invasion gradient in Burro Creek, Arizona, USA. Native roundtail chub, Sonora sucker, and desert sucker all displayed a coordinated displacement of lifetime trophic trajectories to a lower trophic level and reliance on aquatic, rather than terrestrial, resources as indicated by a shift to lower δ13C and δ15N in mixed, relative to native-only, communities. By contrast, the trophic trajectories of nonnative green sunfish and bullhead species remained consistent between native- and nonnative-dominated communities. The presence of nonnative species led to a significantly greater decrease in δ13C through ontogeny for roundtail chub, a species of conservation concern in Arizona. These results demonstrate the prolonged trophic impact of nonnative fishes on native fishes beyond a single life stage. Displacement of ontogenetic dietary shifts by native fishes through interactions with nonnative species may lead to reduced fish growth and fitness, with implications at the population and ecosystem levels. Greater understanding of lifetime trophic trajectories contributes to species conservation and management by predicting and measuring trophic ecology responses at specific ontogenetic stages critical to species persistence.
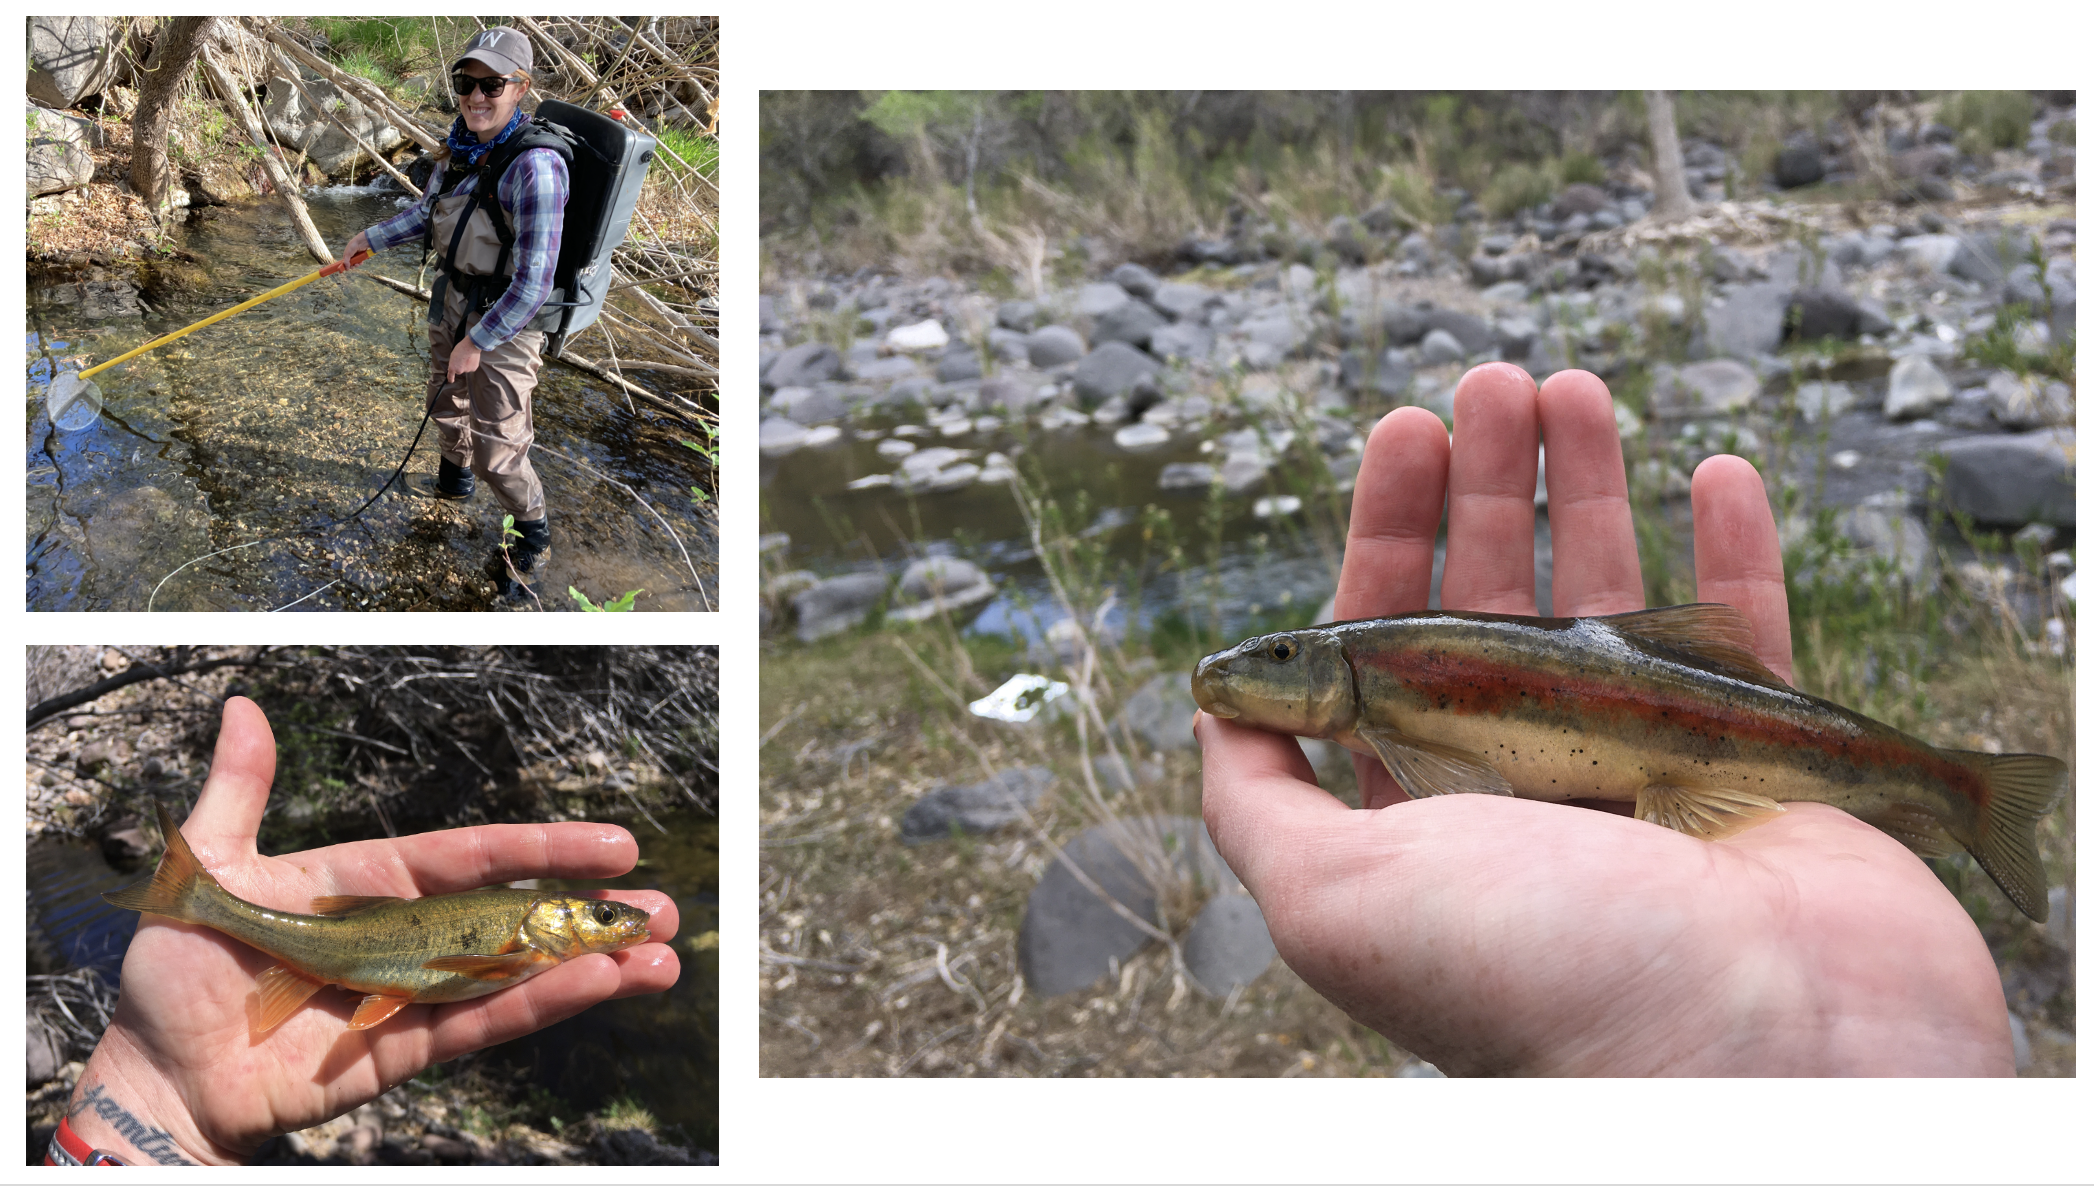 Jess using backpack electrofishing to capture fish in Burro Creek, Arizona during April, 2021 (top left). A roundtail chub (Gila robusta) (lower left) and desert sucker (Catostomus clarkii) (right)
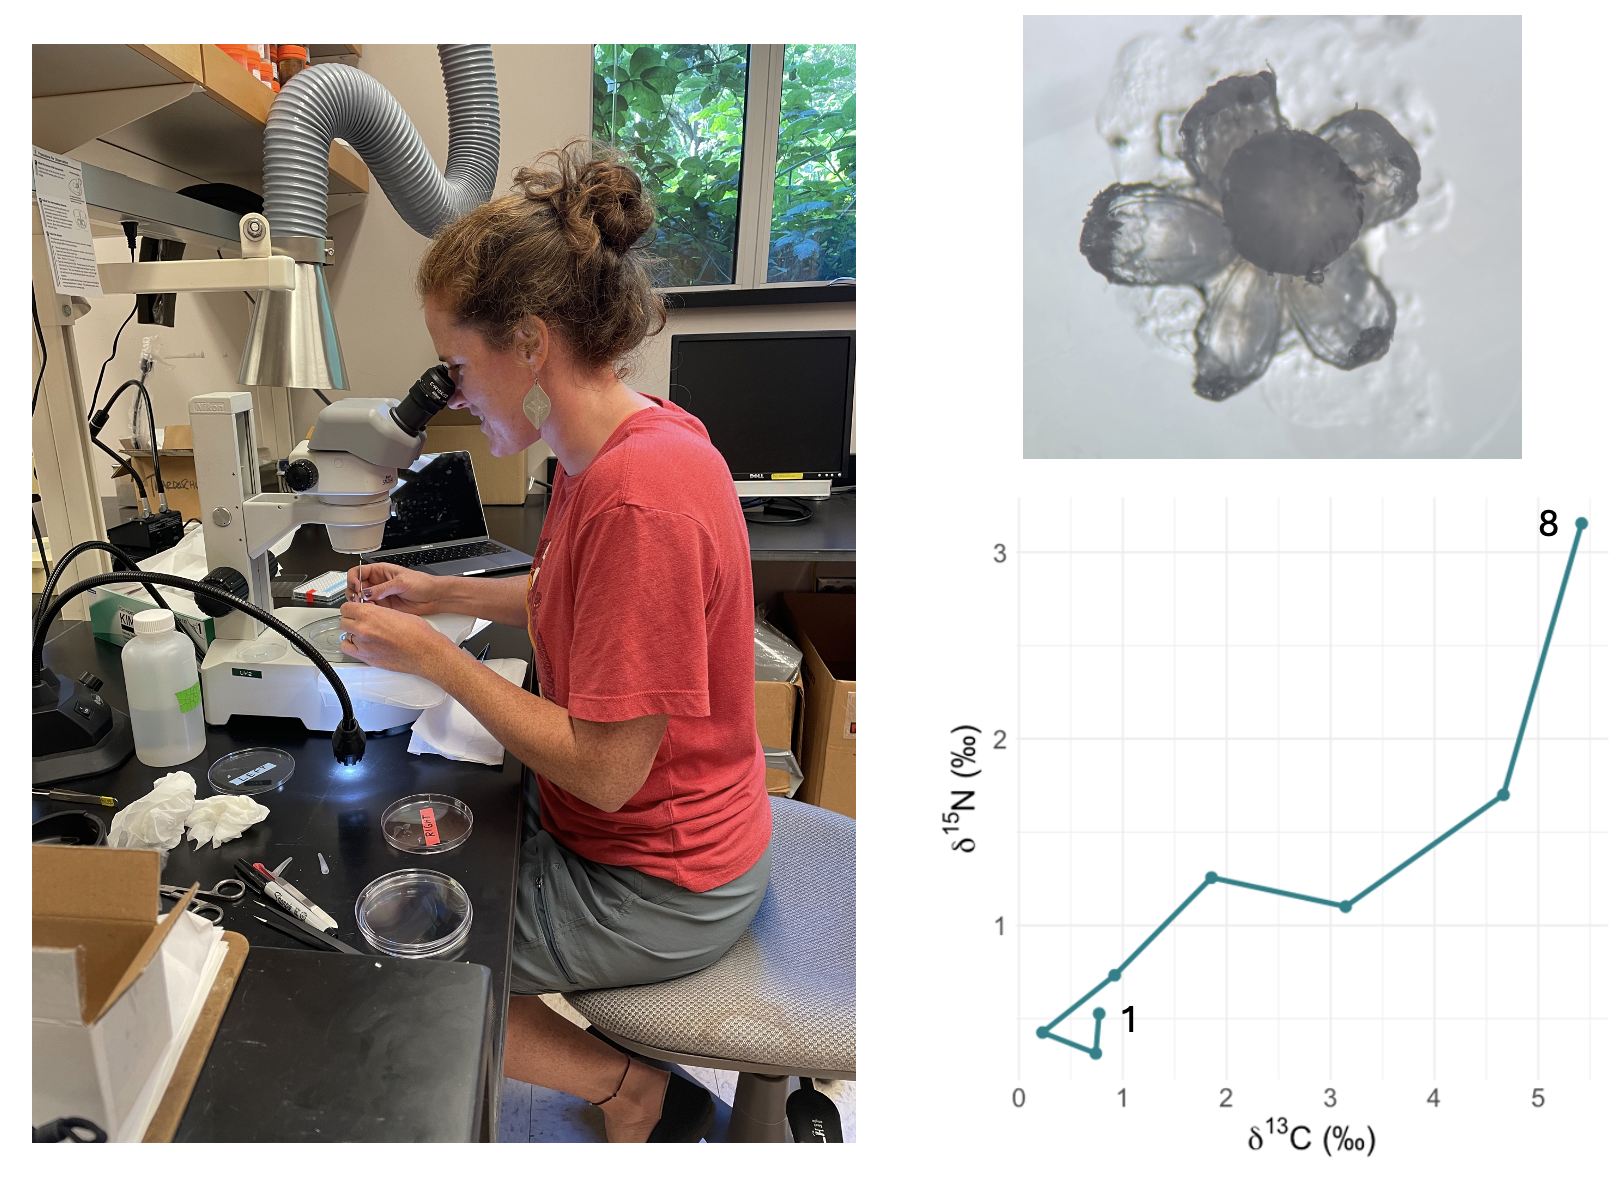 Jess conducting fish eye lens dissection for stable isotope analysis (left). Partially dissected eye lens (top right). Stable isotope results for a single roundtail chub. Eye lens layers are plotted as individual points from the core (1) to the outer layer (8) (bottom right)
Otoliths from captured fish were used to age the fish and link eye lens layers to fish age and points in time. This is possible using species-specific relationships between fish length and eye lens diameter, fish length and otolith diameter, as well as individual fish measurements of growth (age vs. fish length).
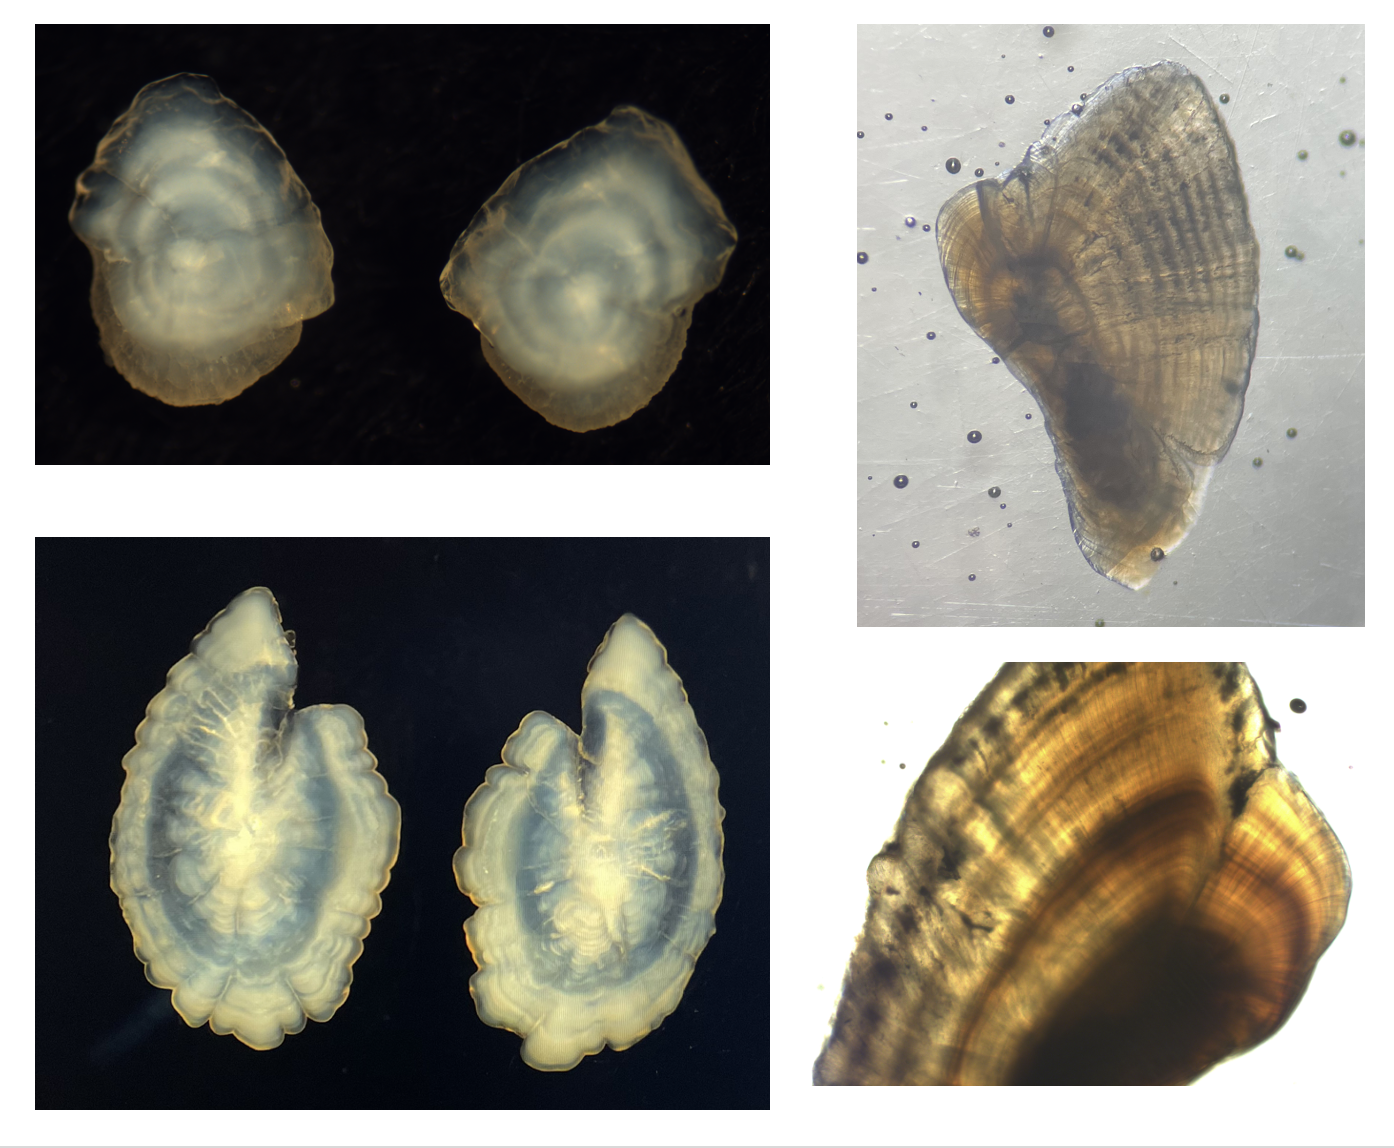 Roundtail chub lapillar otoliths (top left), green sunfish sagittal otoliths (bottom left), roundtail chub polished lapillar otoliths (top and bottom right). Otolith width ~ 2mm
Shifting competition throughout ontogeny between invasive and native stream fishes
Manuscript in preparation
Co-author: Julian Olden
Competition for shared resources within and between species is a powerful force in community ecology. Modern coexistence theory predicts that higher intra-specific, relative to inter-specific, competition results in species coexistence because competitors are self-limiting. However, resource use is rarely constant across animal development; many species experience ontogenetic dietary shifts. Therefore, relative strengths of competition may change throughout ontogeny, leading to a reversal in competitive superiority between two species. Invasive species are often superior competitors due to their generalist feeding habits and high rates of resource exploitation. To quantify competition through ontogeny between invasive and native fishes, we measured isotopic niche overlap of individual lifetime trophic trajectories constructed using fish eye lens stable isotope analysis coupled with otolith growth measurements. We found that invasive green sunfish (Lepomis cyanellus) experienced higher intra-specific isotopic niche overlap through ontogeny relative to inter-specific overlap with three native fish species (Gila robusta, Catostomus insignis, Catostomus clarkii) in Burro Creek, Arizona. These native fish species experienced the highest isotopic niche overlap with green sunfish, known to be a superior competitor. The degree of competition experienced by native species increased through ontogeny, while invasive green sunfish were freed from high interspecific competition at older ages. Our results demonstrate that the coexistence in mixed native-nonnative communities is supported by modern coexistence theory. As invasive species continue to spread and proliferate, contemporary ecological communities are increasingly being managed for coexistence, rather than invader eradication. Understanding how relative competition transforms through ontogeny supports coexistence conservation in native-nonnative communities.
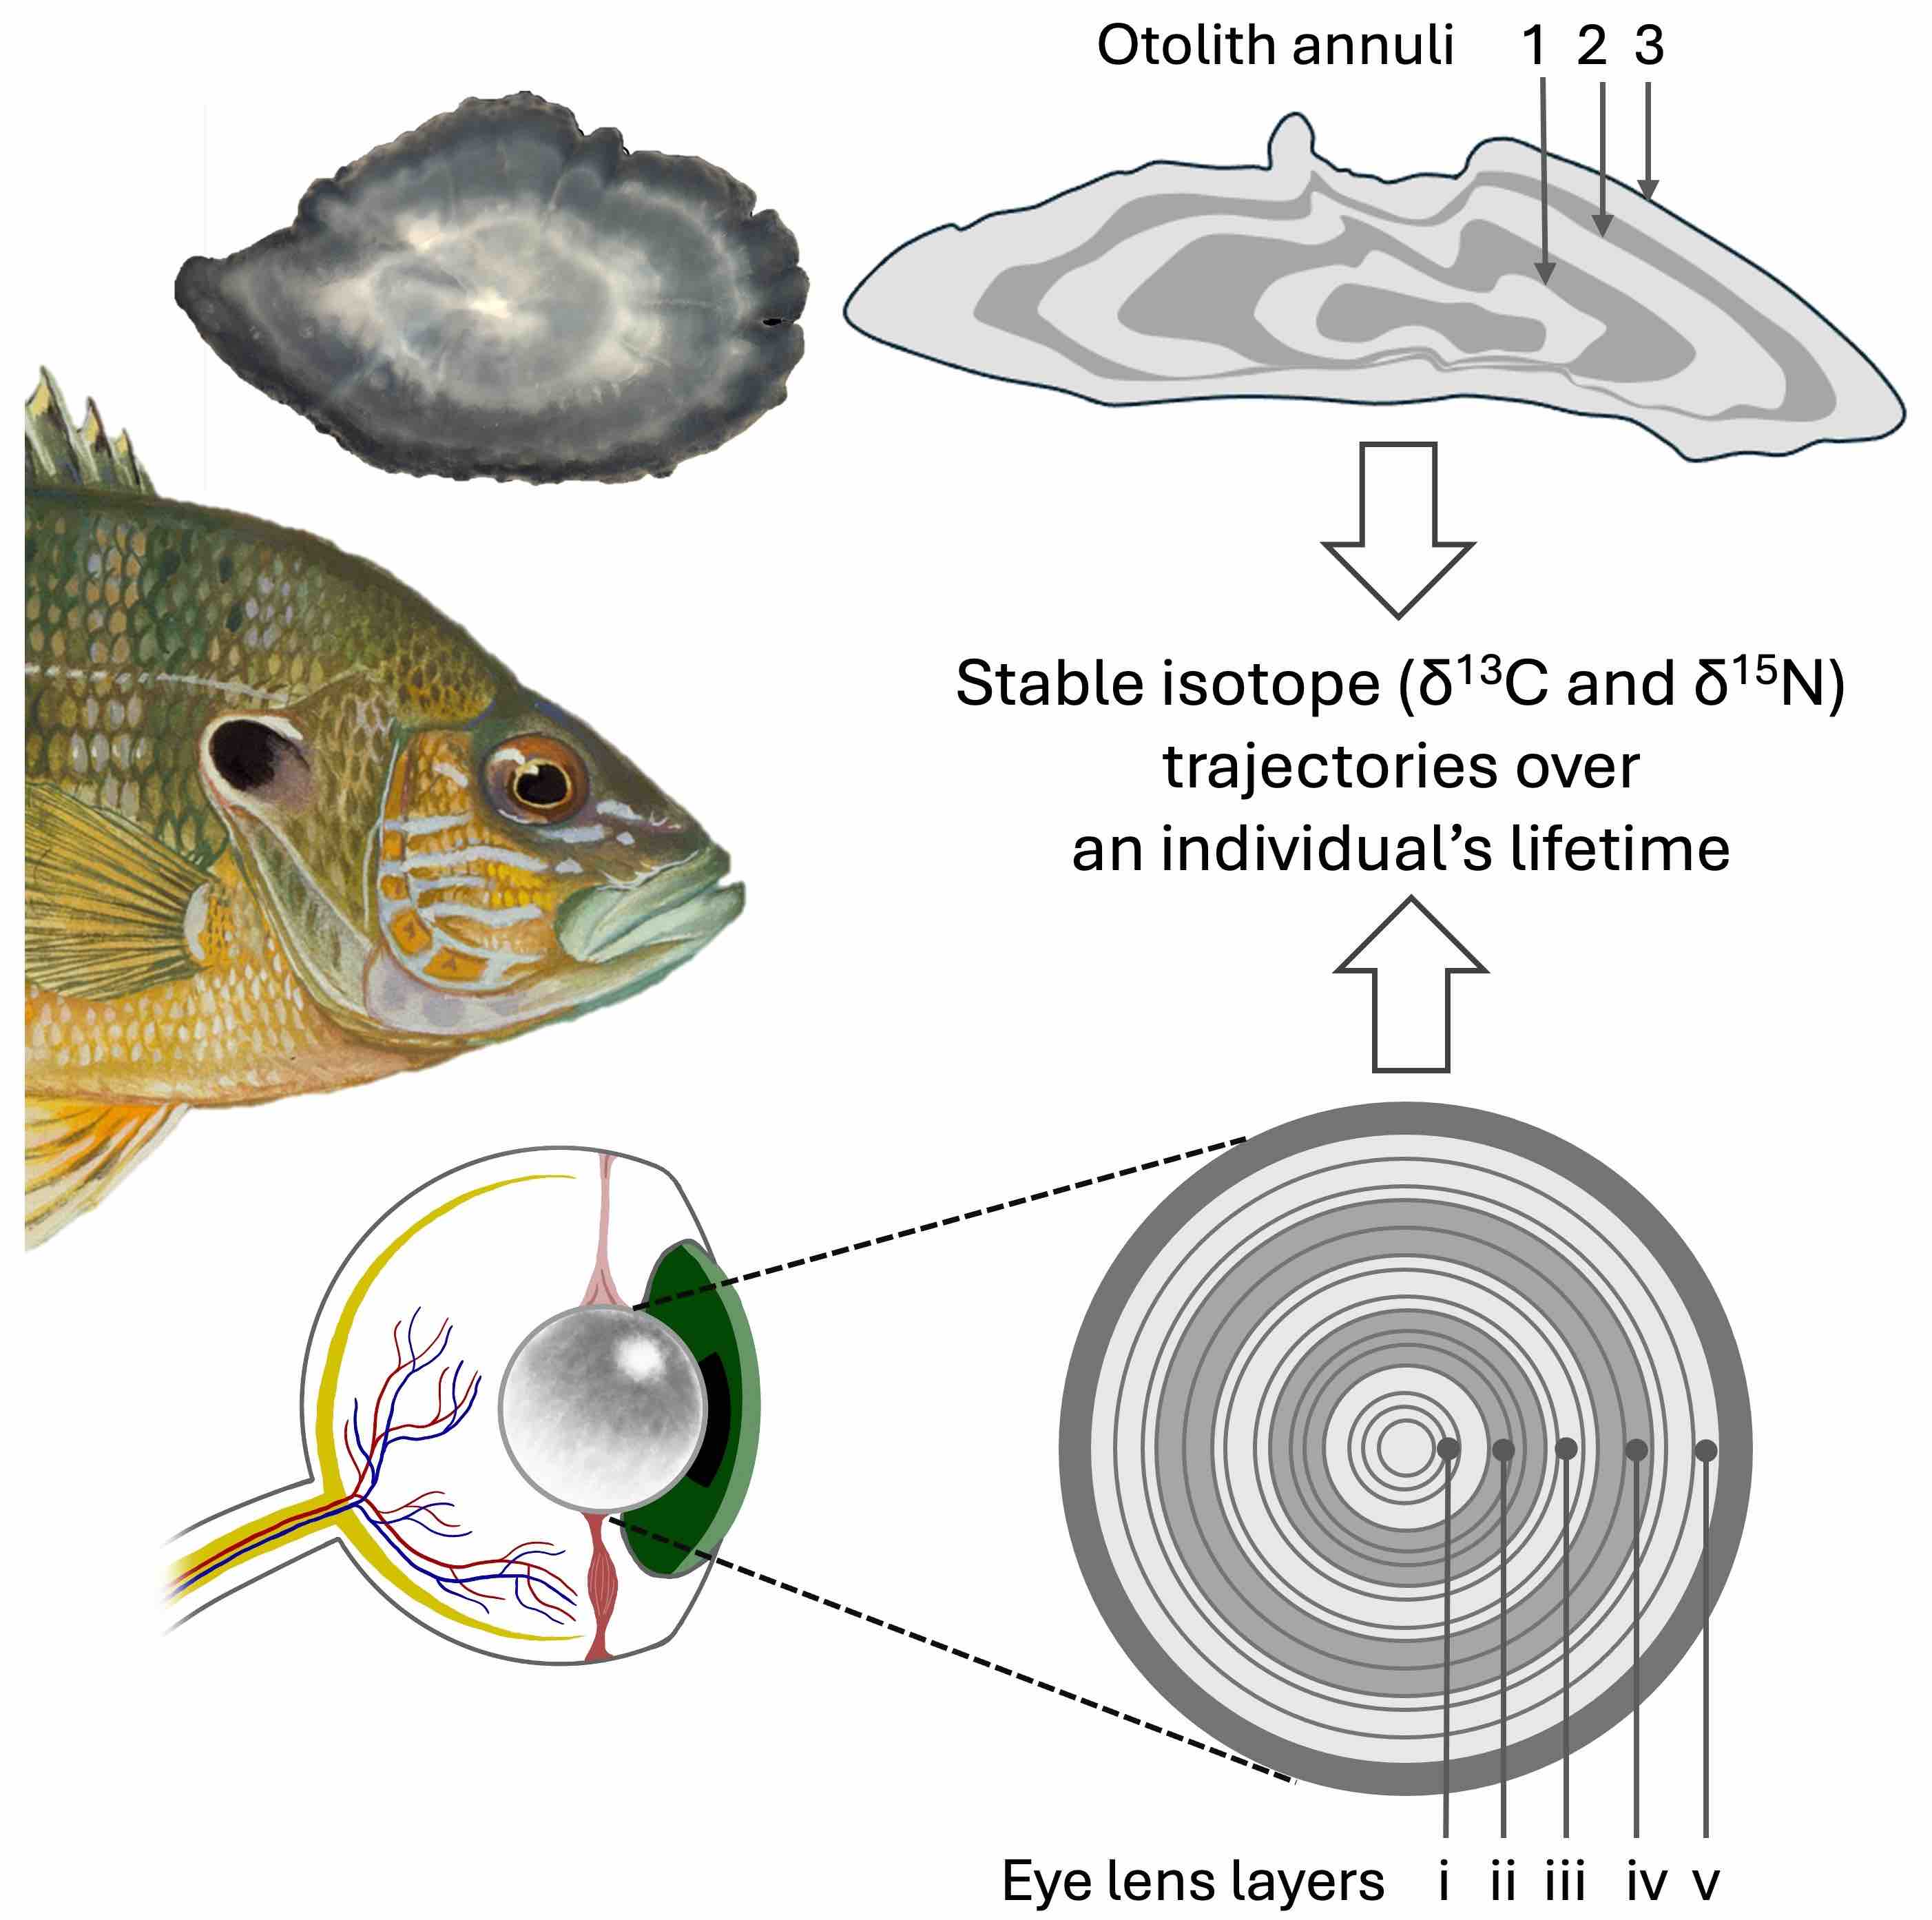
Diagram of whole (left) and cross-sectioned (right) green sunfish otolith (top) and eye lens (bottom). Otolith annuli are labeled 1-3 for each year of fish age and growth. Eye lens layers are labeled from the core (1) representing early ontogeny to the outer layer (5) representing activity prior to capture. When processed for δ13C and δ15N stable isotope analysis, the sequence of eye lens layers provide a lifetime trophic trajectory of an individual fish. This is combined with otolith aging measurements to link stable isotope values to fish age. Fish illustration by Duane Raver (Public domain, U.S. Fish and Wildlife Service National Digital Library). Otolith image and all other illustrations by Jessica Diallo.
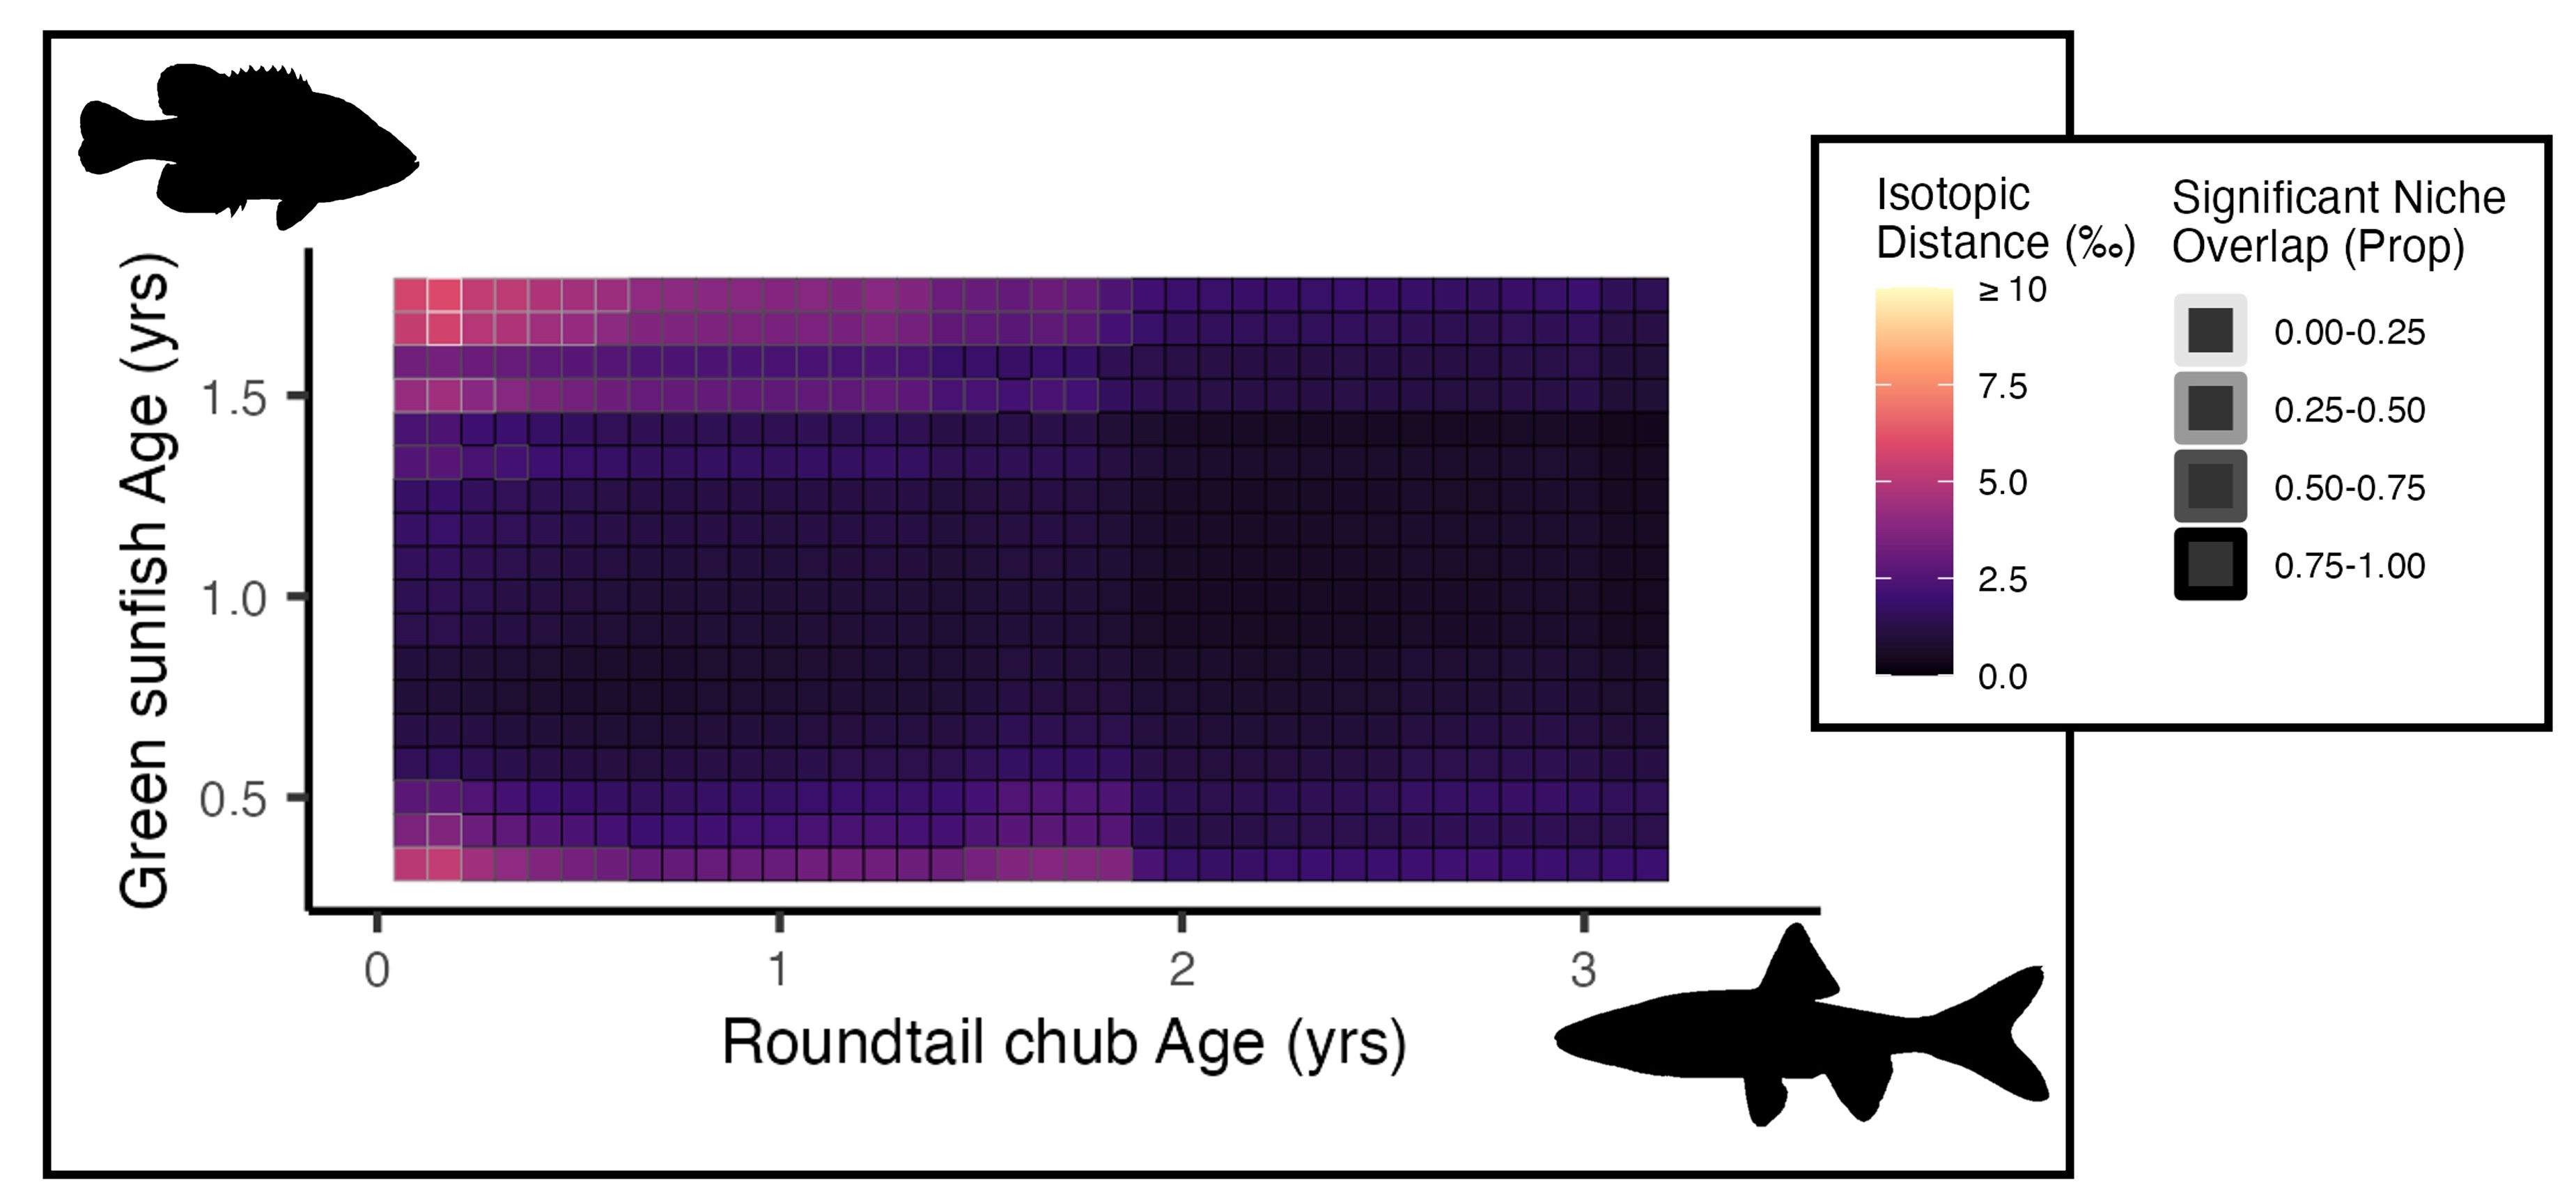
Competitive interaction surface displaying isotopic distance across the lifetimes of focal species roundtail chub (x-axis) and competitor green sunfish (y-axis). Isotopic distance is defined as the squared Mahalanobis distance (D2), which measures the distance from an individual point to the centroid of the competitor’s isotopic niche in C-N biplot space. Interaction squares represent a month of time and are outlined a shade of grey representing significant niche overlap, or the proportion of the focal species individuals that significantly overlap with the competitor’s isotopic niche based on a chi-square distribution.
Optimizing control of a freshwater invader in time and space
Manuscript in press (Ecological Applications)
Co-authors: Sarah Converse1, Matt Chmiel2, Andy Stites2, Julian Olden1
1: University of Washington
2: Arizona Game and Fish Department
The global spread of invasive species in aquatic ecosystems has prompted population control efforts to mitigate negative impacts on native species and ecosystem functions. Removal programs that optimally allocate removal effort across space and time offer promise for improving invader suppression or eradication, especially given the limited resources available to these programs. However, science-based guidance to inform such programs remains limited. This study leverages two intensive fish removal programs for nonnative green sunfish (Lepomis cyanellus) in intermittent streams of the Bill Williams River basin in Arizona, USA, to explore alternative management strategies involving variable allocation of removal effort in time and space and compare static versus dynamic decision rules. We used Bayesian hierarchical modeling to estimate demographic parameters using existing removal data, with evidence that both removal programs led to at least a 0.39 probability of eradication. Simulated alternative management strategies revealed that population suppression, but not eradication, could be achieved with reduced effort, and that dynamic management practices that respond to species abundance in real time can improve the efficiency of removal efforts. High removal frequency and program duration, including continued monitoring after zero fish were captured, contributed to successful population control. With management efforts struggling to keep pace with the rising spread and impacts of invasive species, this research demonstrates the utility of quantitative removal models to help improve invasive removal programs and robustly evaluate the success of population suppression and eradication.
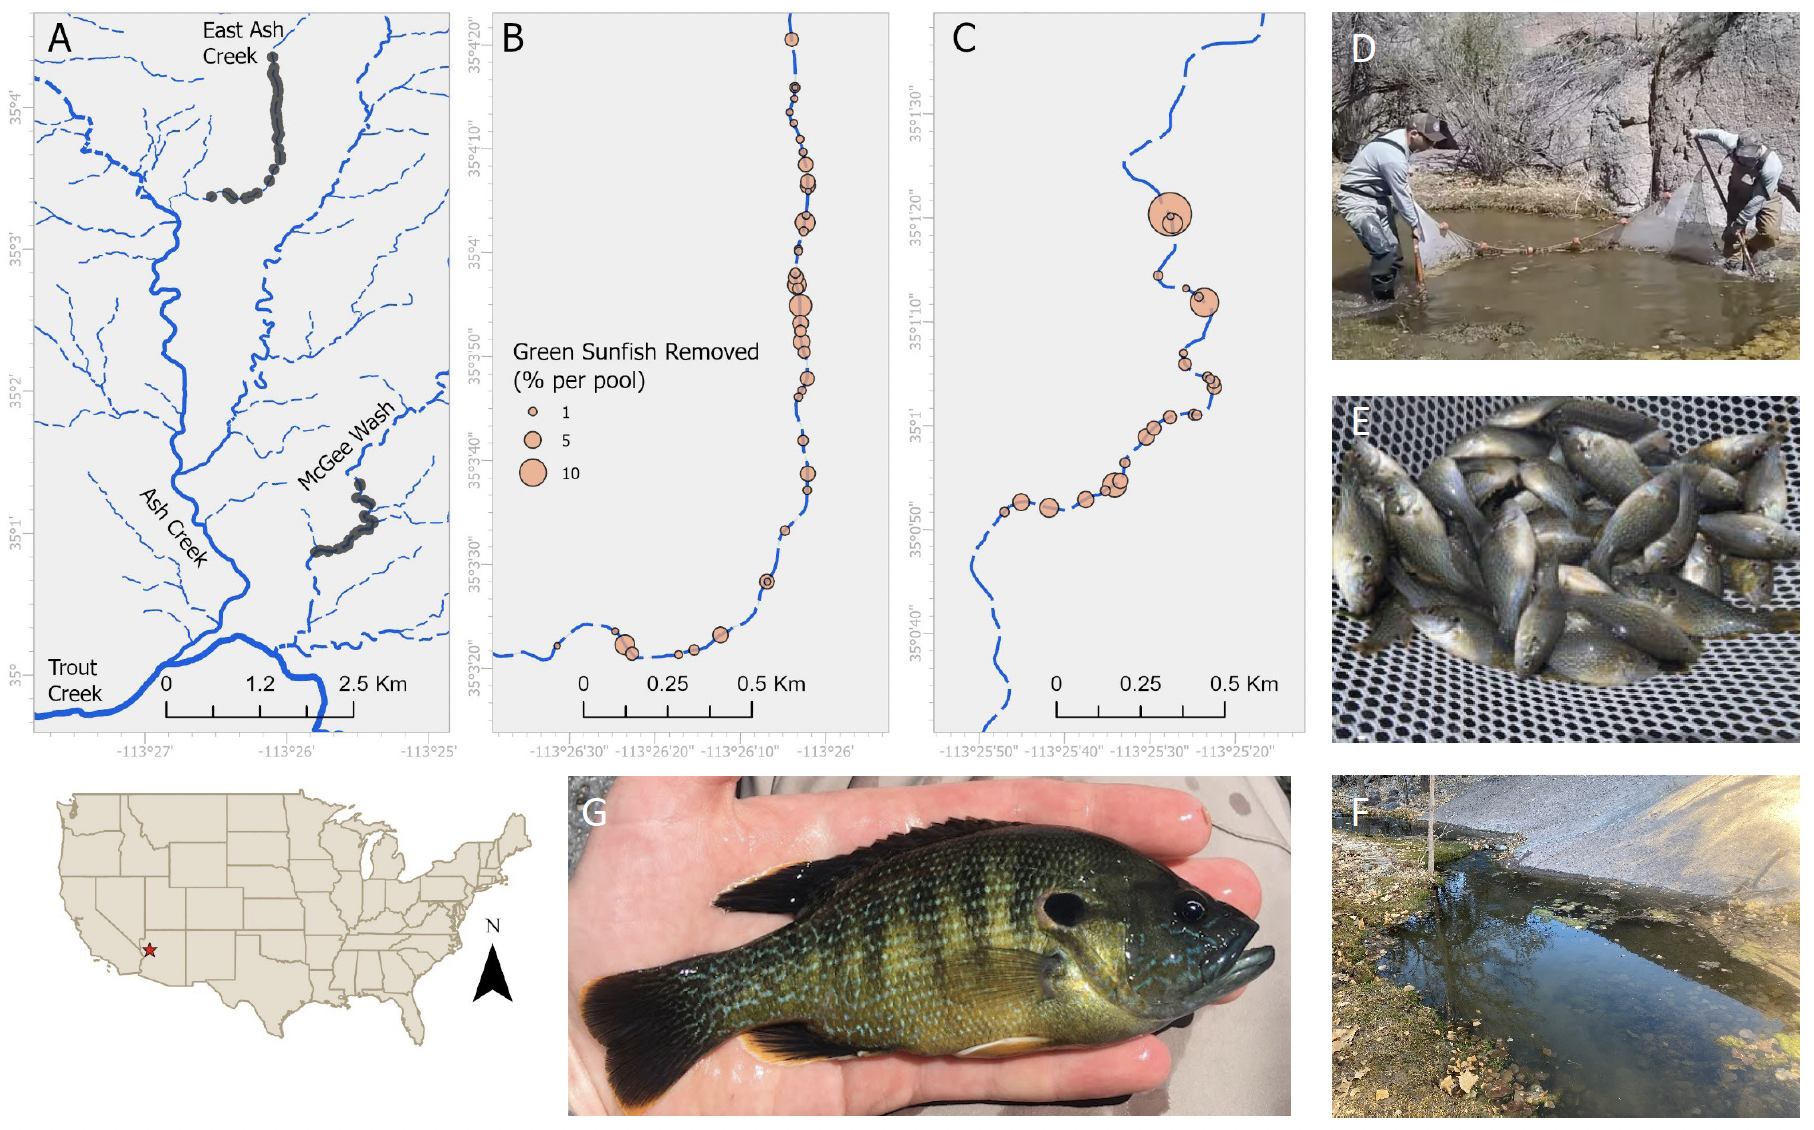
Map of tributaries within Trout Creek, AZ watershed where the Arizona Game and Fish Department (AZGFD) conducted green sunfish removals. Removal sites are identified by points. Panel A is the watershed including all removal sites, panel B is East Ash Creek, and panel C is McGee Wash. Panel D is AZGFD biologist David Partridge using a backpack electrofisher to remove fish from East Ash Creek (photo credit Gregg Cummins), panel E is a net full of green sunfish (photo credit Julian Olden), panel F is one of the pools in McGee Wash (photo credit Andy Stites), and panel G is a close up of a green sunfish caught in Burro Creek within the Bill Williams River basin, AZ (photo credit Jessica Diallo). Bottom left inset shows the greater region with the Bill Williams River basin in dark brown and a red star identifying the location of green sunfish removals.
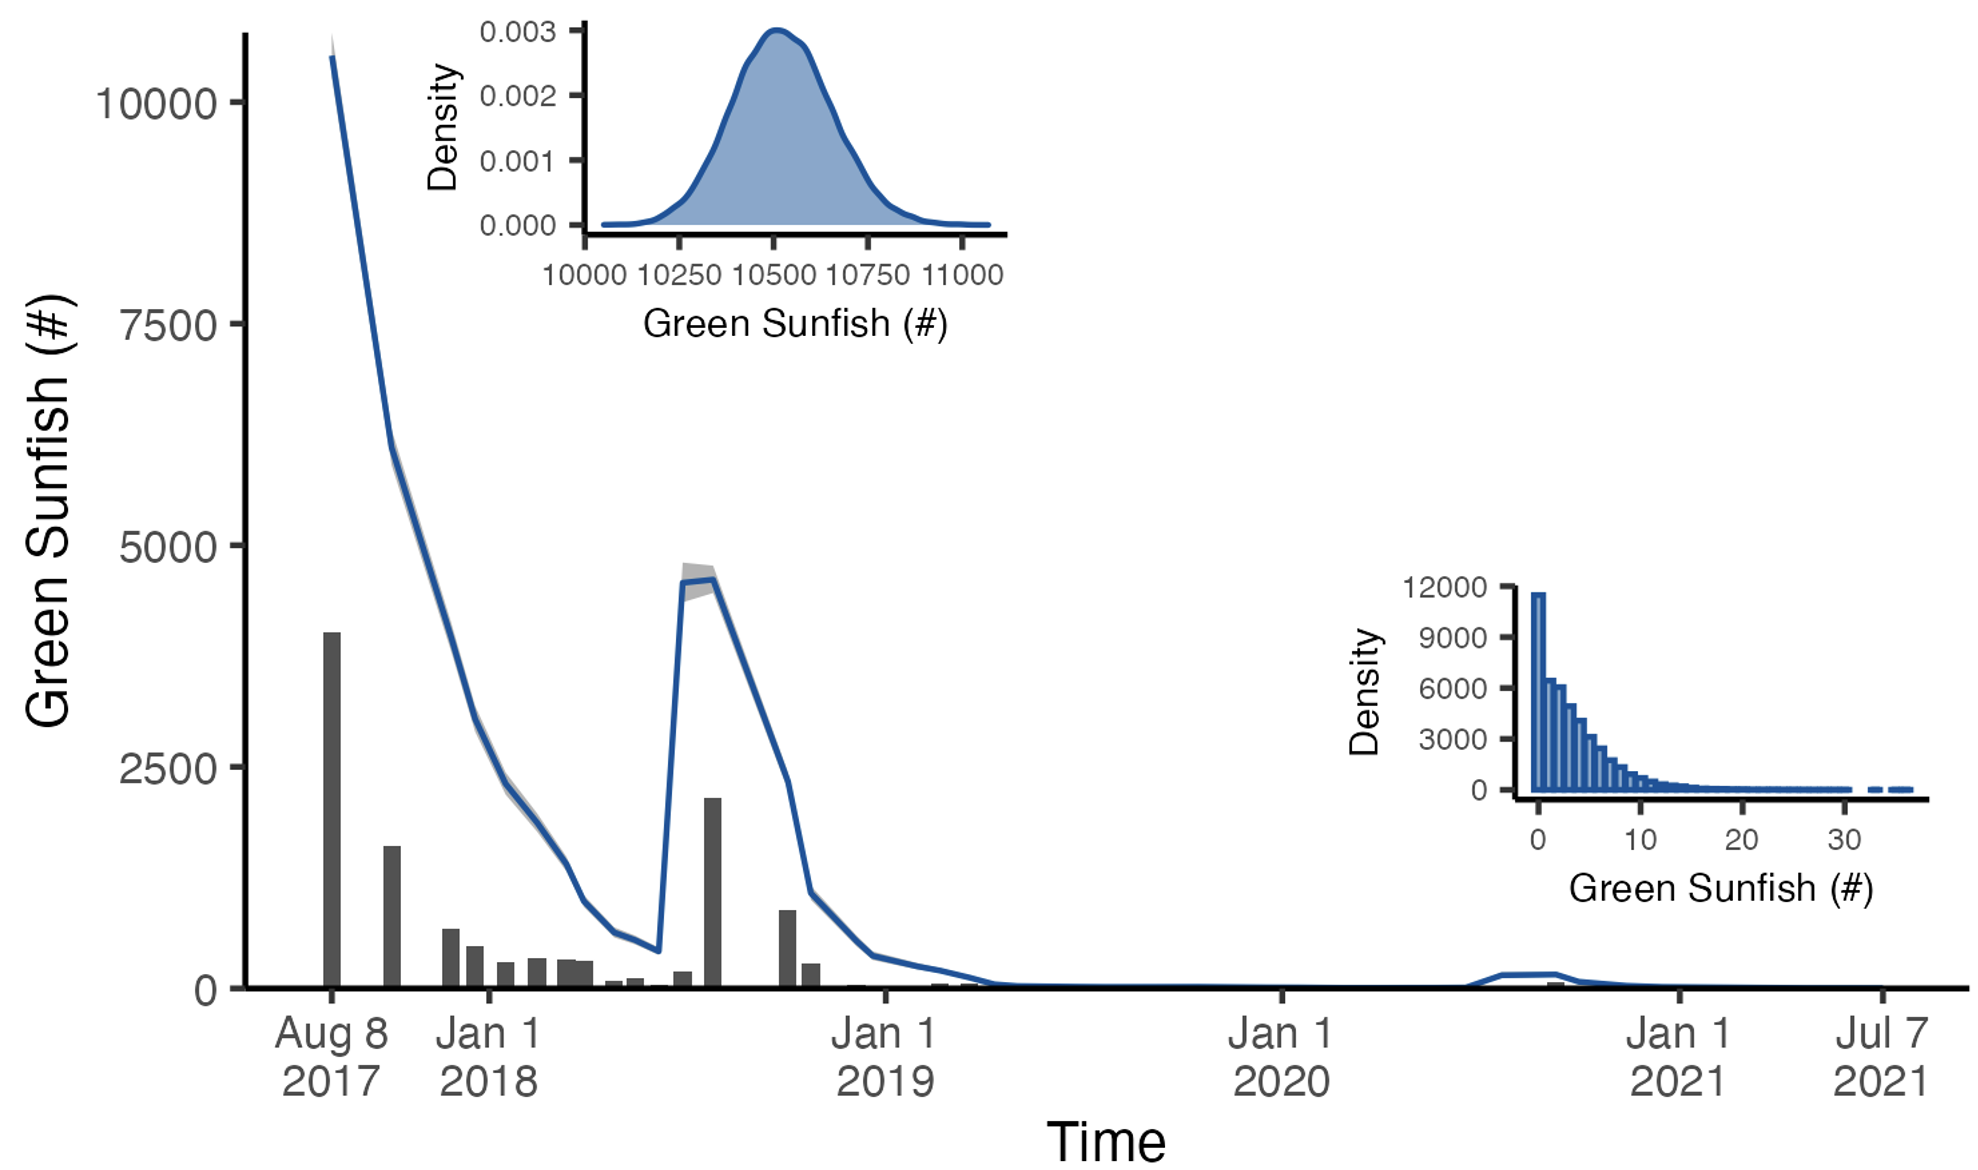
Model estimated green sunfish population (line) and number removed (grey bars) over time in McGee Wash, Arizona. Insets show posterior probability distributions of the total population at the start (upper left) and end (lower right) of the removal program. Grey ribbon represents the 95% credible interval.
Leveraging PIT tag data to better understand northern pikeminnow movement in the Columbia River Basin
Manuscript in preparation
Co-authors: Beth Sanderson1, Katie Barnas1, Jim Faulkner1, Grant Waltz2, Eric Winther3, and Julian Olden4
1: NOAA Northwest Fisheries Science Center
2: Oregon Department of Fish and Wildlife
3: Washington Department of Fish and Wildlife
4: University of Washington
Northern pikeminnow are native to the Columbia River, but their increased predation of juvenile salmonids due to habitat modification has led to long-term population control efforts. The Northern Pikeminnow Management Program (NPMP) is a targeted harvest program with a sport reward fishery that has been operating in the Columbia and Lower Snake Rivers since 1991. As a result of this sport reward fishery, over 5.5 million piscivorous (≥ 200mm FL) northern pikeminnow have been harvested for cash rewards. Each year data are collected to monitor and evaluate the program; however, the program has come under scrutiny in recent years due to outdated analytical methods. Northern pikeminnow have been PIT tagged through the NPMP since 2003 to calculate the program’s exploitation rate, with the goal of reducing the population by 10-20%. The model used helps estimate the program’s annual reduction in predation and assumes closed populations separated by dams, though this assumption relies on limited evidence. After being tagged, most northern pikeminnow are never recaptured, but their movement is passively tracked by PIT tag antennas. We combined data from the Columbia Basin PIT Tag Information System (PTAGIS) database with NPMP tagging and harvest data. Movement records reveal that individuals traveled as far as 968 km. Nearly 13% of northern pikeminnow tagged through the NPMP were detected in different reservoirs (or river sections separated by dams) from where they were initially tagged. Movement in tributaries and across mainstem dams reflect seasonal patterns aligned with upstream spawning migration. This increased understanding northern pikeminnow movement informs calculation of the exploitation rate, one of the key measures of NPMP success. Further, as the NPMP adapts over time, information on northern pikeminnow movement may also contribute to future management strategies.
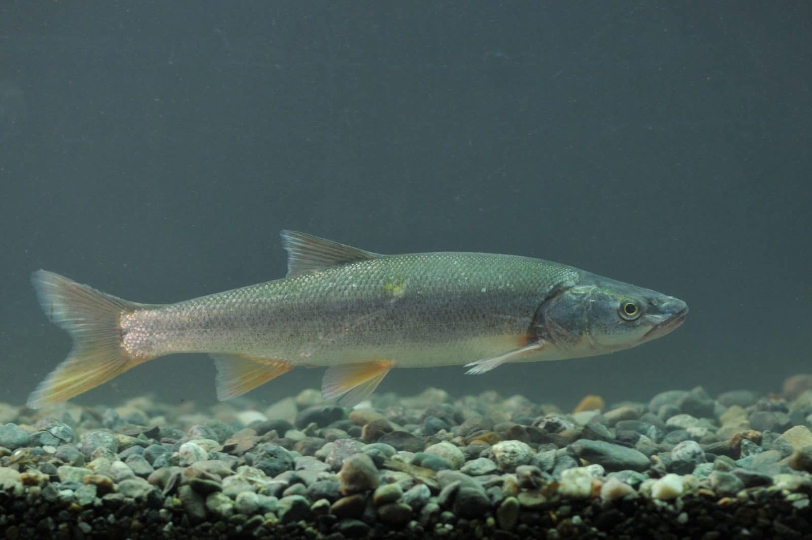
Northern pikeminnow (photo credit: Fernando Lessa)
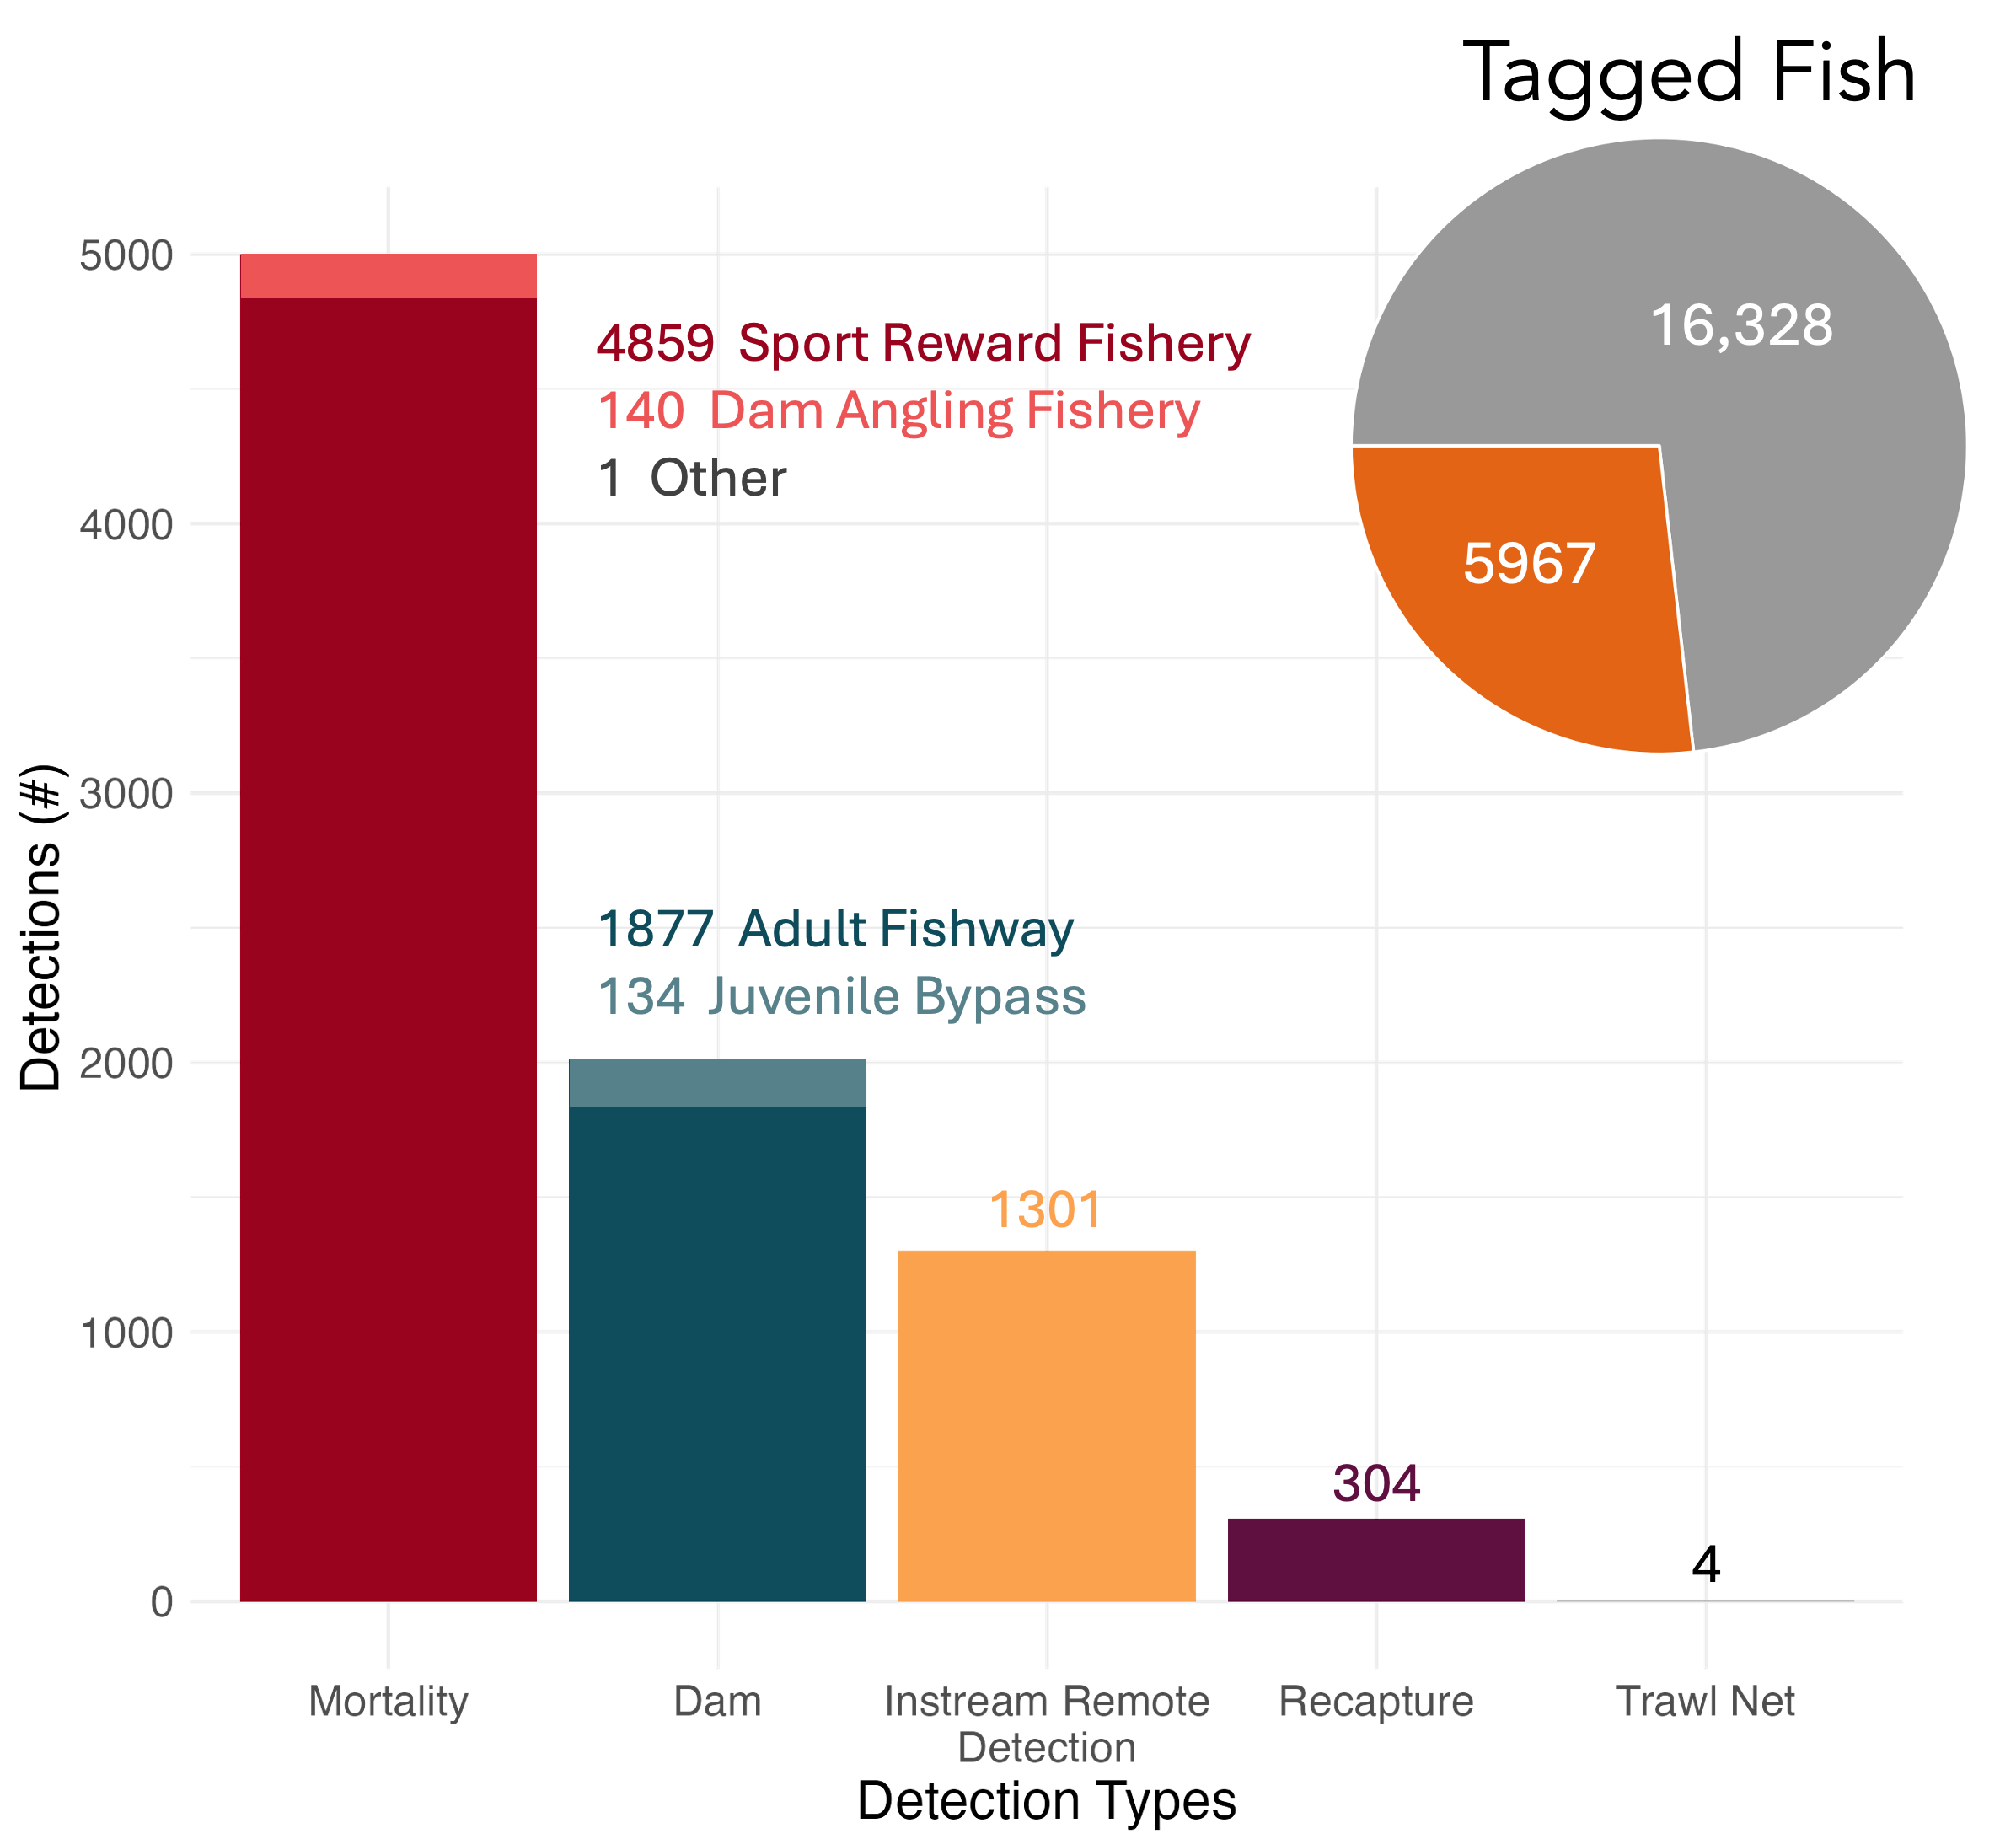
Barplot displaying the detection types for 5967 northern pikeminnow subsequently detected after being tagged through the Northern Pikeminnow Management Program.
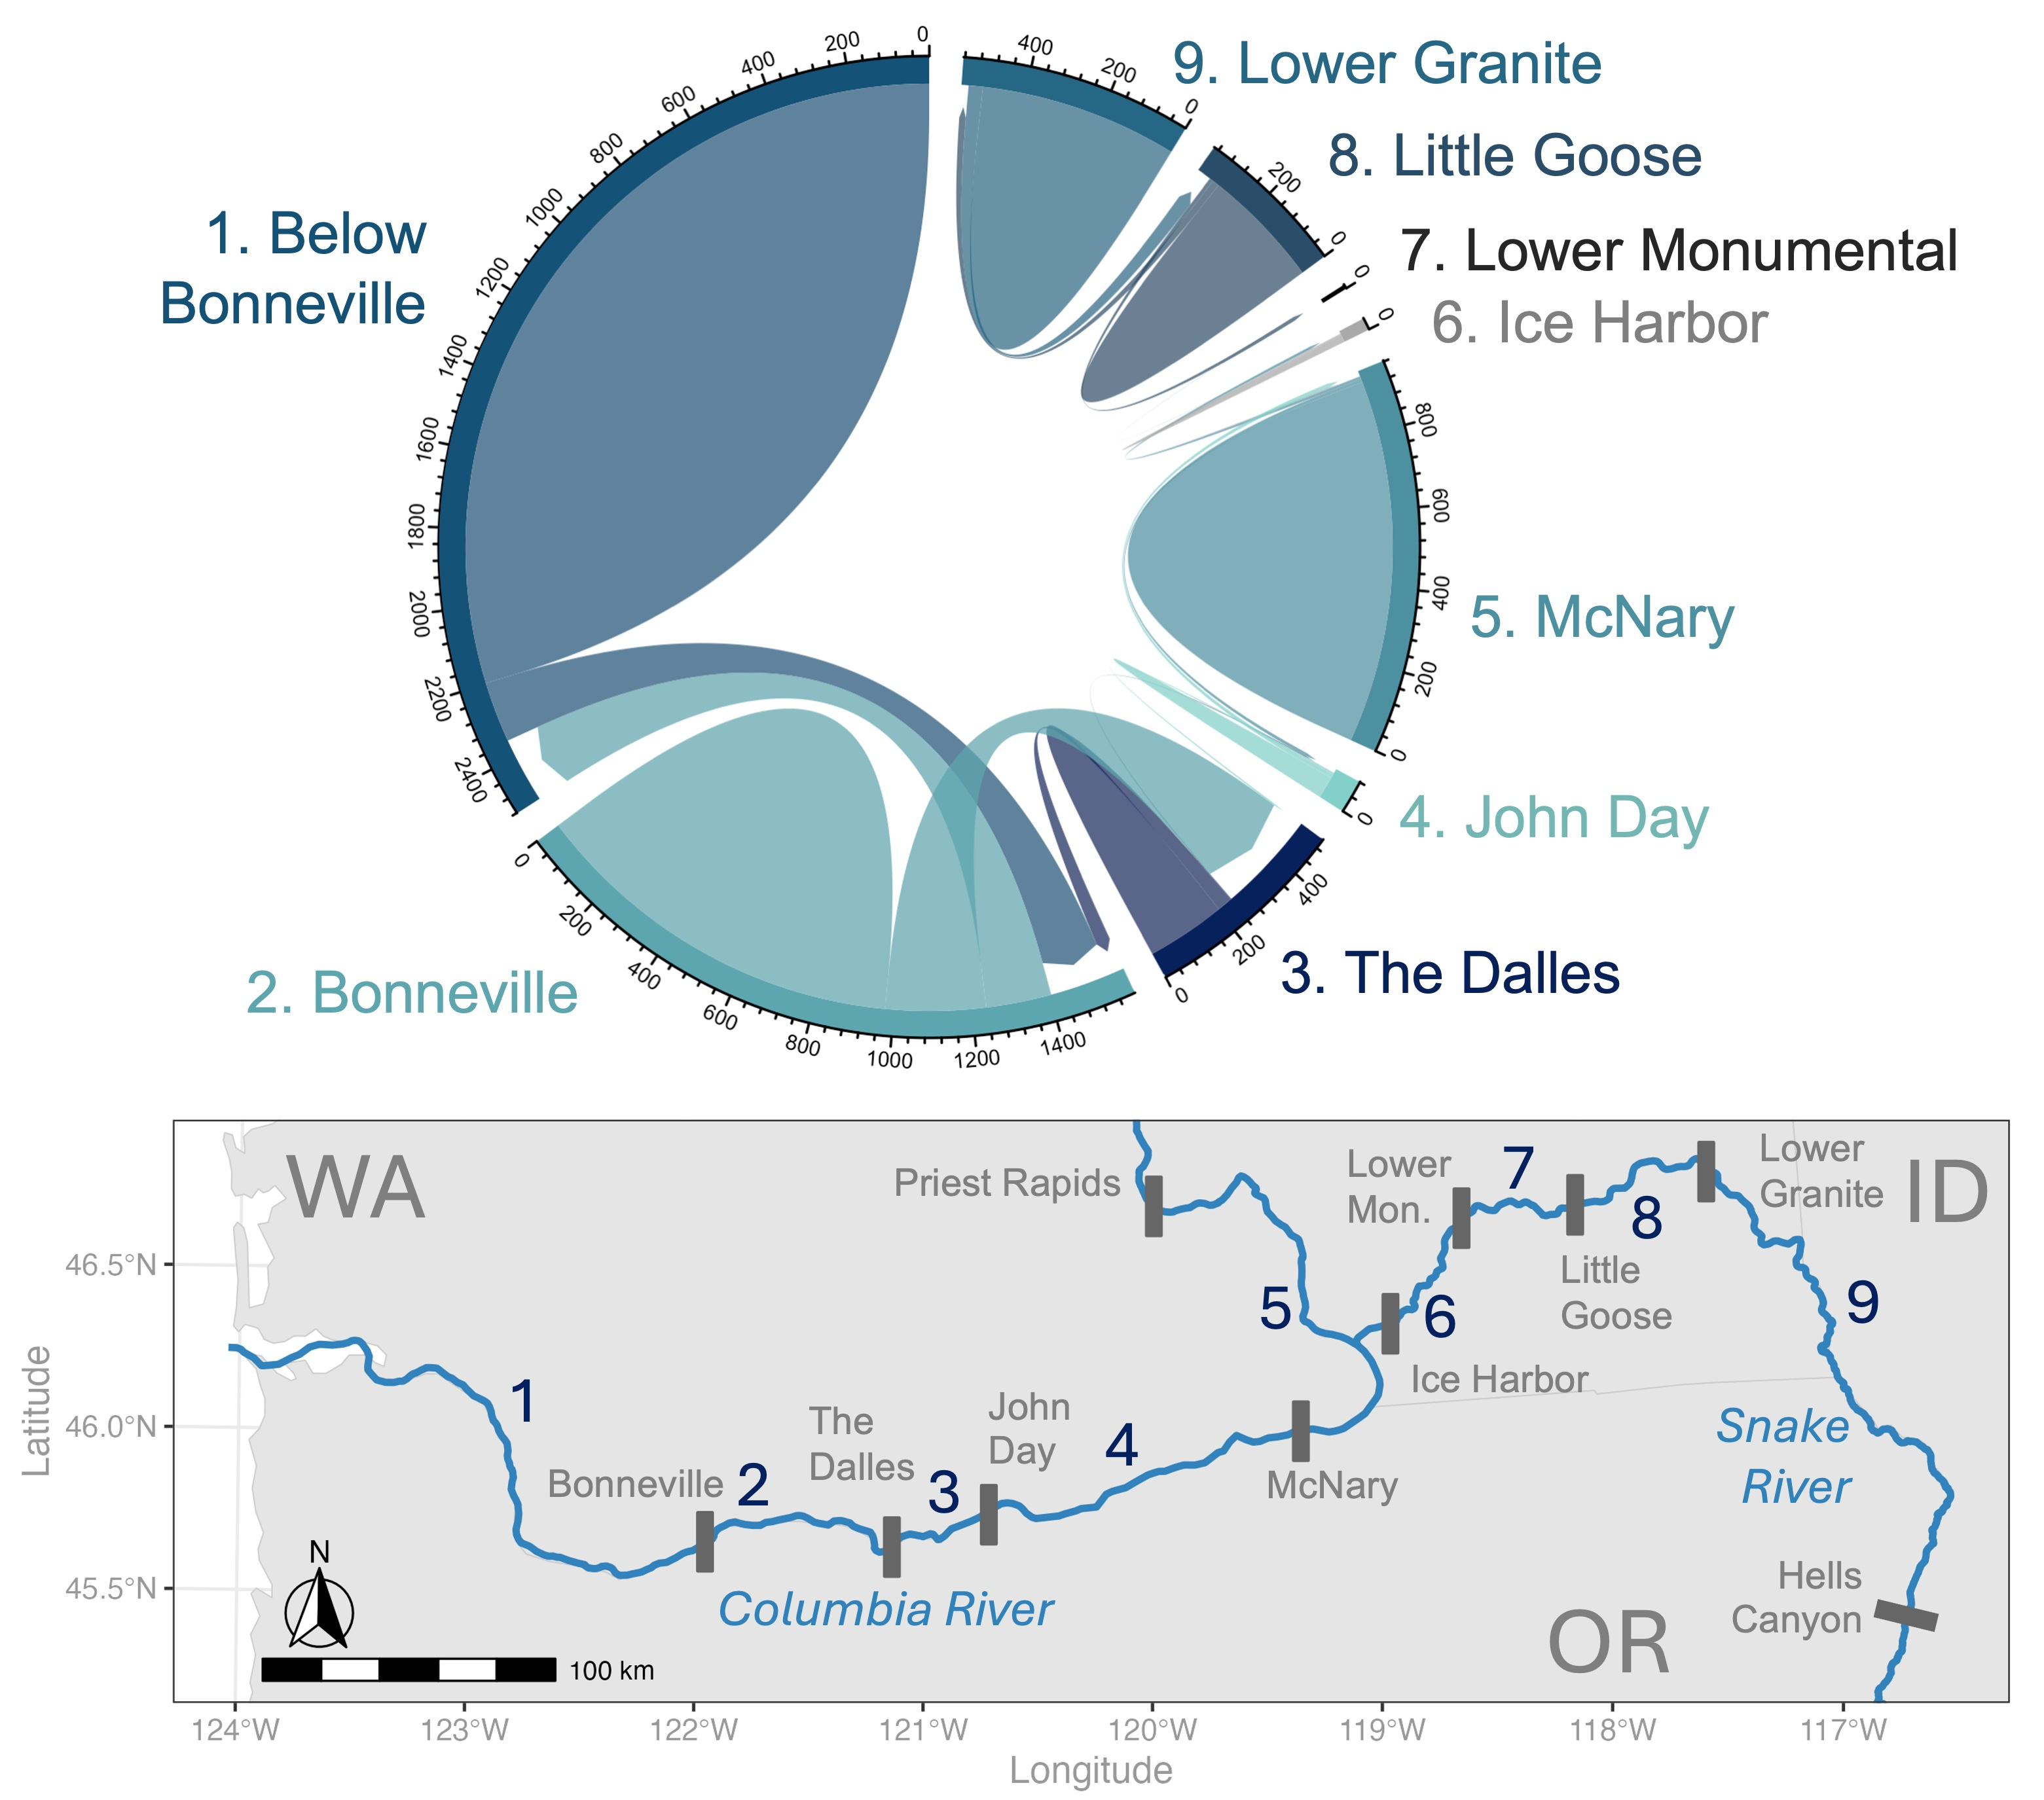
Top figure is a chord diagram displaying the movement of PIT-tagged northern pikeminnow across dams within the bounds of the Northern Pikeminnow Management Program. Each number represents a single fish and the furthest they were detected traveling. Arrows indicate movement between adjacent reaches with the thickness proportional to the number of fish. Shaded areas without arrows represent fish that were only detected in their tagged reach. Numbered labels 1-9 identify river reaches or reservoirs separated by dams (as shown in the map below).